How do I know if my breeding business is growing? Order analytics in QueenBees
- QueenBees Team
- News , Features
- May 14, 2026
Every professional queen bee breeder knows the question at the start of the season: is this year going better or worse than last year? Gut feeling can be misleading — especially when you’re handling dozens or hundreds of orders, with production spread across multiple weeks, batches, and locations.
That’s why we’ve expanded order analytics in QueenBees with a set of tools that give you concrete answers — no spreadsheets or manual counting required.
Everything in one place
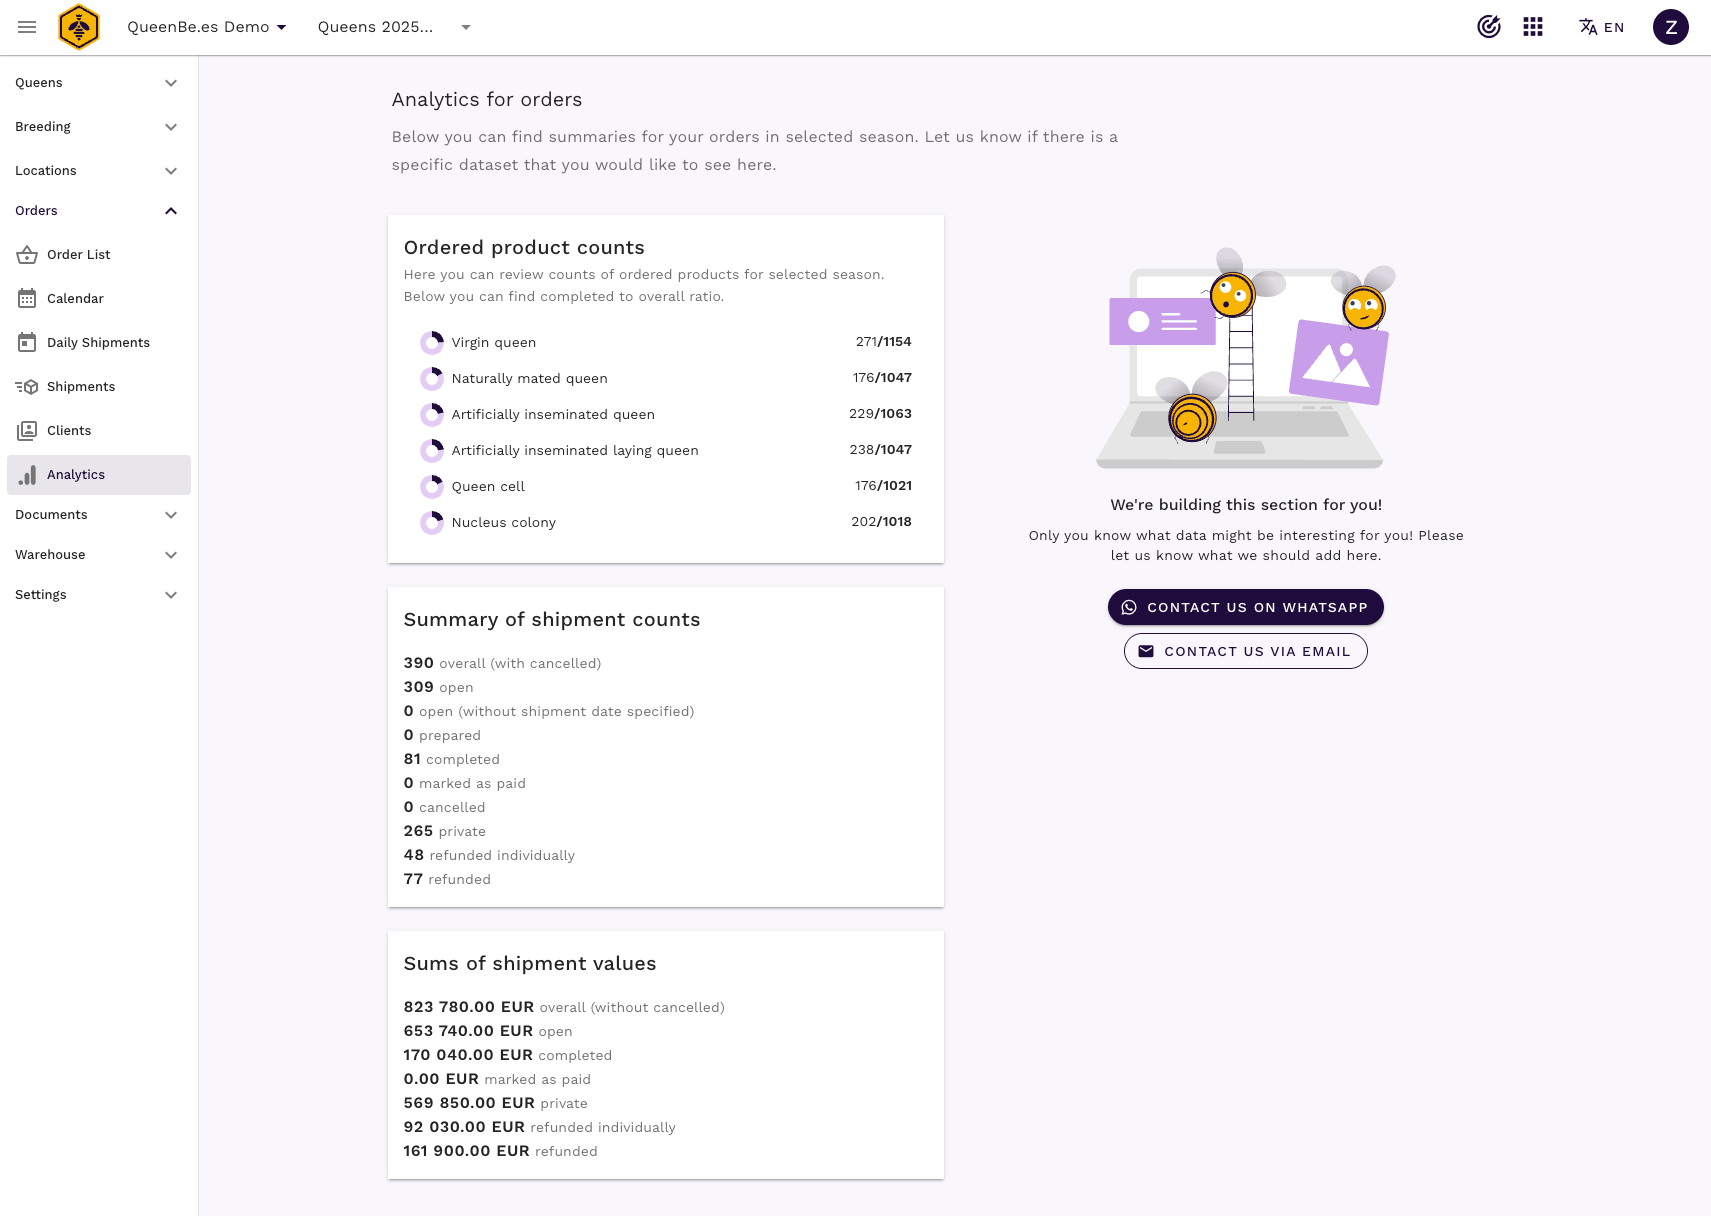
You’ll find the order analytics panel in the menu under Orders → Analytics. At the top of the page you can set a date range and — importantly — choose a season to compare against. If you want to see how May 2026 stacks up against May 2025, it takes just a few clicks.
Below the filters you’ll see KPI tiles with the most important numbers: order value, number of shipments sent, average order value. It’s your first glance at how the season is performing.
When do customers order — and when do they pay?
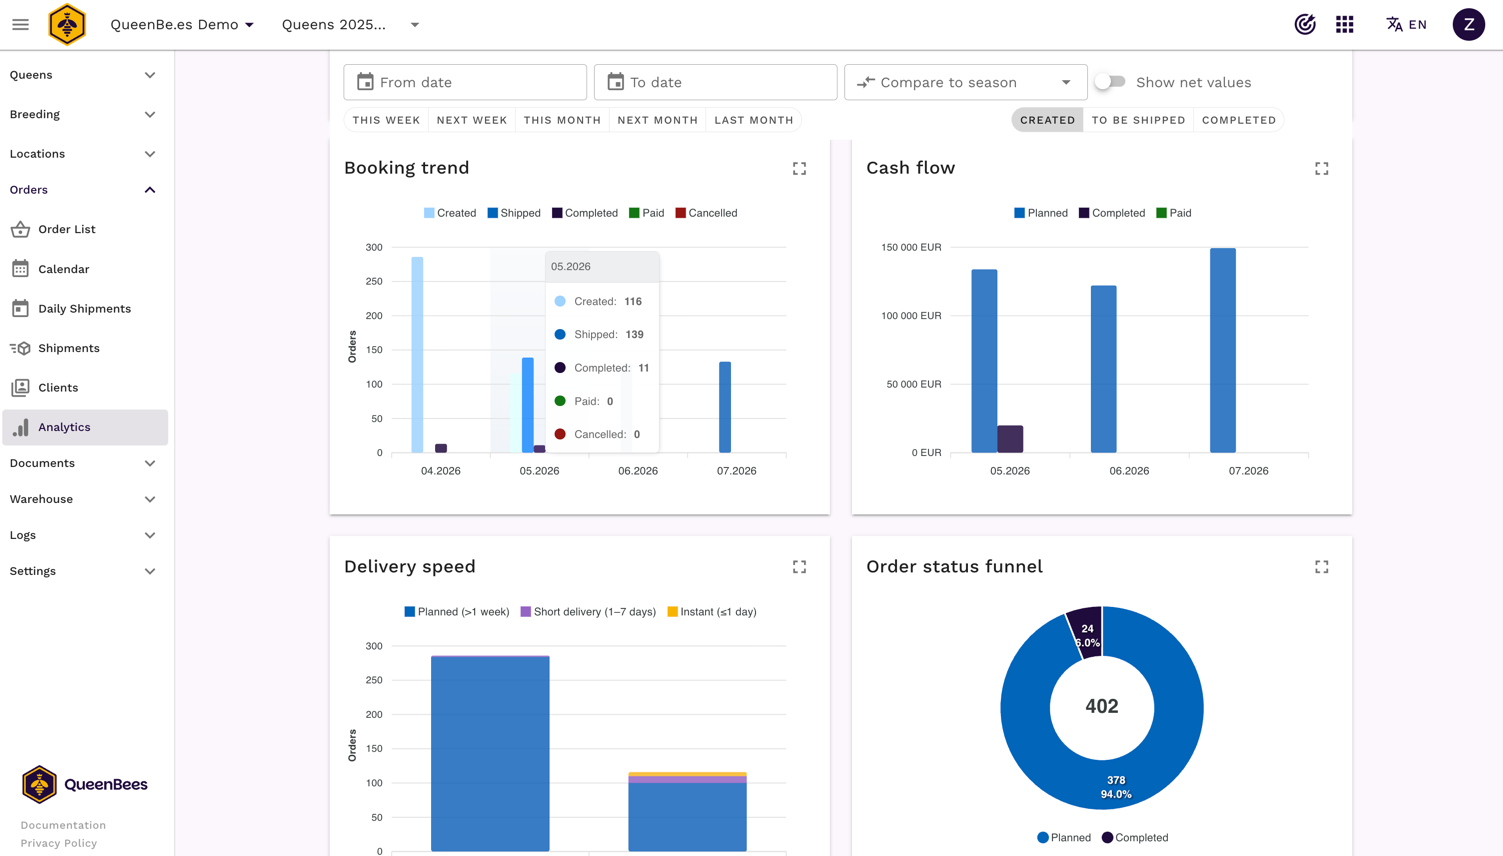
The orders chart shows how orders arrive over time, broken down into placed, shipped, and cancelled. You can see whether the season started earlier than last year, whether there’s a dip after Easter, and where the order peak falls.
Next to it is the cash flow chart — not revenue on paper, but actual incoming payments plotted on a timeline. For a breeder planning equipment purchases or hiring seasonal help, this is critical information: when will the money actually hit your account. By marking orders as paid, you get real data on cash arriving in your operation.
How fast do you go from order to delivery?
The delivery speed chart shows how much time passes between an order being placed and it being shipped. It’s one of those service quality indicators that’s easy to overlook in the daily rush. If delivery times stretched in a particular week, the chart will show it before a customer reaches out to ask. It also helps you understand the rhythm of your season and react to order backlogs before they become a problem.
Where are you losing orders?
The sales funnel shows how many orders move through each stage: placed → planned → shipped → paid. If there’s significant drop-off between shipping and payment, it may be worth shortening your payment terms or setting up reminders for customers.
Which queens sell best — and how many do I have booked for a specific date?
The queen type calendar shows which types of queens (by mating status) were or will be ordered in each week of the season. This lets you plan your mating schedule so you have queens ready for customers when they need them.
Alongside the calendar you’ll find order source and customer mix charts — where your buyers come from and how many orders include refunds.
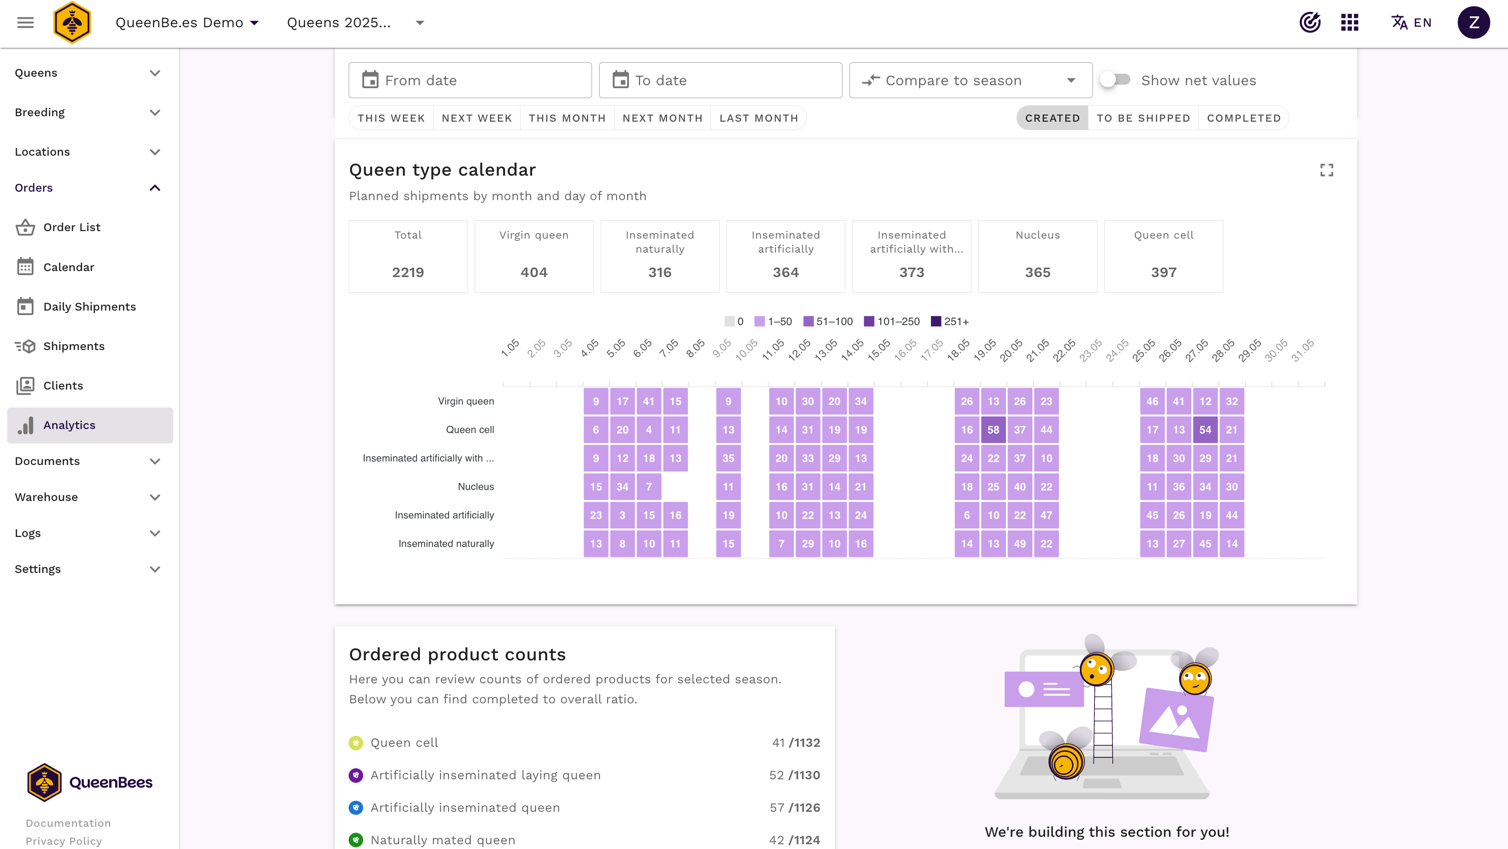
Filtering and season-over-season comparison
You can filter the analytics data by time period, focusing on current, past, or upcoming work.
Some charts can be displayed with the previous season’s data overlaid. This lets you answer the question every growing breeder asks themselves: am I growing, standing still, or falling behind?
Order analytics is available to all QueenBees breeders on a paid plan. If you have questions about interpreting your data or want to discuss how to get the most out of it for your operation — get in touch.
Contact: info@queenbe.es or WhatsApp. We respond within 24 hours.